


Metrics decomposition using synthetic funnels
Decomposing freight revenue for a logistics company


TL;DR
Metrics decompositions are powerful and accessible analytical techniques.
Funnels are easily decomposable as the product of conversion rates from one stage to another.
A common technique in metrics design is to divide and multiply by a given submetric: finding goods submetrics remains part of the art of metric decompositions.
Some metrics can be shown to be derived from synthetic funnels: this simplifies finding a submetric used to divide and multiply.
I show two examples of the technique: I decompose revenue for a logistics company, and describe how this was also used in a previous post where I decomposed ad revenue for a social network.
Context
In the past I’ve made the following two assertions about metric decompositions:1
Usefulness: metrics decomposition is an important skill in the analytical toolkit
Accessible: metrics decomposition can be done by everyone
Usefulness comes from the ability to analytically approach a problem that otherwise may feel unsurmountable. To be sure, I mostly use it to find the right metric and the right levers in a given decision-making problem.
Accessibility, however, has been harder to demonstrate. Funnel decompositions are easy enough, and I’ve found that once you learn it, you “start seeing funnels everywhere”. But the more general technique of “divide and multiply by some submetric” generates confusion, because it’s far from obvious how to pick that submetric.

In this post I’ll show that if you can pose a problem as a synthetic funnel, you can then apply the same simple funnel logic, considerably simplifying the problem of finding what submetric to use in the multiple-and-divide trick. I’ll do this with the following logistics problem:
The problem
You work for a logistics company whose core business is the distribution of goods and your task is to find strategies to increase revenue and profits?
The decomposition
Revenue can be decomposed as the product of unit price, load factor, vehicle utilization and the size of the fleet:
My claim is that this decomposition allows us to find submetrics that are more easily actionable. To be sure, if you want to increase revenue (for a fixed time window), you can increase:
The unit or average price: defined as the ratio of revenue (dollars) to total load (in kilograms)
Load factor: defined as the average load (volume) per run (trips)
Vehicle utilization: defined as the ratio of total runs in the time window (trips) to fleet size (vehicles used)
Size of the fleet (vehicles used)
How to find the decomposition: divide and multiply
The trick to find the decomposition is to sequentially multiply and divide by a chosen submetric:
Step 1: multiply and divide by Load
Step 2: multiply and divide by Runs
Step 3:multiply and divide by Fleet size
The first ratio is the now standard unit price. As a reminder, if you want to get price in your decomposition, find a way to multiply and divide revenue by quantity or volume.
To get unit price: divide revenue by the volume or quantity in your specific business
The next two terms are more interesting since they quantify different efficiency dimensions.
The second ratio tells you that to increase revenue you can start by moving more load per run. For instance, it’s more efficient to move 100 kilograms per run than 10 kilograms per run. Unfortunately this ratio is bounded by the maximum capacity that your fleet has, so a natural lever is getting bigger vehicles (think of a train!). A less costly lever is implementing better packaging, say by standardizing the boxes used.
The third ratio measures how well you’re utilizing your fleet. Do you have many stationary vehicles? Can you get more runs from each vehicle? Again, there are important restrictions and trade-offs. More runs may depreciate your vehicle faster, forcing you to take them to maintenance more frequently, reducing your effective fleet. But even if this isn’t a concern, you can only do so many runs in a fixed time window.
There are other ways to improve upon this decomposition, but I hope this gives you a flavor of what can be accomplished.
What is a funnel?
A funnel has the following characteristics:
Sequential: traverses a journey, stage by stage
Unit consistency: the entity or unit that traverses the journey is the same across the whole funnel
Filtering: the metric under study never increases
These properties explain why funnels are relatively straightforward to work with. For instance, the metric (and units) never change, so you just do measurements from stage to stage. And importantly, starting with the metric at the final stage, you just multiply and divide by the metric in the previous stage, a process repeated until you reach the beginning of the funnel.
Choosing a submetric to multiply and divide is straightforward with funnels: at each step, you just use the metric measured at the previous stage.
Synthetic funnels
So funnels are great, and you’ll find them everywhere, but unfortunately not everything is a funnel. Here’s where synthetic funnels play an important role.2
Synthetic funnels are great, because once you identify them you can apply the same trick to choose the submetric used to multiply and divide. To be sure, at each stage, you multiply and divide by the metric of the previous stage.
The next figure shows our synthetic funnel. Let’s traverse it backwards:
Revenue: this is the metric that we care about, and is measured in your local currency (e.g. dollars).
We create revenue by transporting goods (load) from one place to another. This is the most immediate cause for revenue (we charge per volume).
You need actual runs to transport the load.
You need actual vehicles or a fleet to operate these runs.
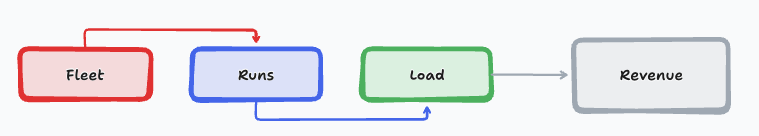
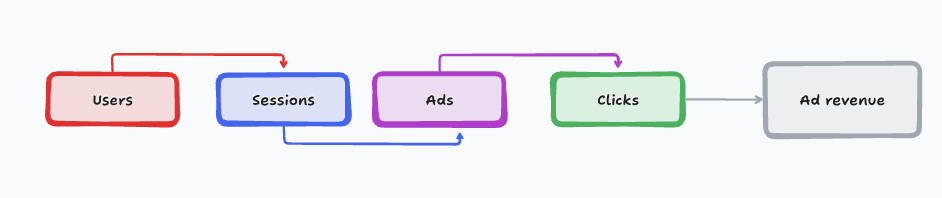
My claim is that the sequence of objects (fleet > runs > load > revenue) is quite logical, and when that’s the case you’ll find that creating a decomposition for these synthetic funnels is very easy! As another example, the next figure shows the synthetic funnel for the case of ad revenue I presented in an earlier post.
What’s next?
You are now ready to go and decompose almost every metric you care about! I hope that you start seeing funnels, and synthetic funnels, everywhere.
Both books that I’ve written discuss metrics design, but Data Science: The Hard Parts is certainly the most exhaustive. But you can also check my post on marathon running, or how I decomposed ad revenue for the case of a social network like Meta.
According to ChatGPT, these are also referred to as non-canonical funnels, but there’s no agreed label for them. I’ll be using the “synthetic funnel” label in the absence of a better name.