


Metrics, decompositions, and decision-making


As I’ve expressed elsewhere, metrics design (and metrics decompositions) are an important part of the data scientist (DS) toolkit. But the leap from one to the other is not straightforward. In this post I’ll make the case by looking at the problem of ad revenue generation from the point of view of a social network (think Tik Tok, Facebook, etc.).
Decomposing ad revenue
I’ll start with the decomposition and fill out any missing details afterwards.
Let’s give these ratios some names to make it more digestible:
where
Rev: ad revenue
RPC: revenue per click
CTR: click-through rate
If we measure everything on a per day basis, you can replace Users with DAU (daily active users) and modify the measurements of the other metrics accordingly.
You may not see the beauty of this decomposition at first, but it expresses very precisely, that ad revenue is the product of average price, the click-through rate, the ad load and user engagement (session frequency and active users).
At a higher level of abstraction, the decomposition says that revenue is the product of price (RPC)1, match quality (users and ads), and quantity.
Revenue = Price x Quality x Quantity
What did we accomplish?
My main claim is that this decomposition is more effective at driving decisions. Moreover, it allows us to do so in a data-driven, evidence-based way.
Consider the following two scenarios:
Scenario 1: The Product team has come up with a new feature Y, and the DS designs an experiment to quantify its impact on a business metric.
Scenario 2: The DS is asked to come up with ideas for new features to improve the business.
A good decomposition simplifies the task in both scenarios. In Scenario 1, it should help identify the right success metric for the experiment, along with any additional metrics that need to be tracked or used as guardrails). In Scenario 2, you begin with the right metric and only then look for levers or new product features to move it.
Scenario 1: evaluate the impact of a feature
Let’s say that Product is planning to launch a new feature: a revolutionary Like button that anyone can use to show approval of a post.2 Your task as a data scientist is to quantify the business impact, if there’s any. A good decomposition tells you exactly where to focus your efforts.
The next table shows which submetric is most likely to be impacted by the new Like button.
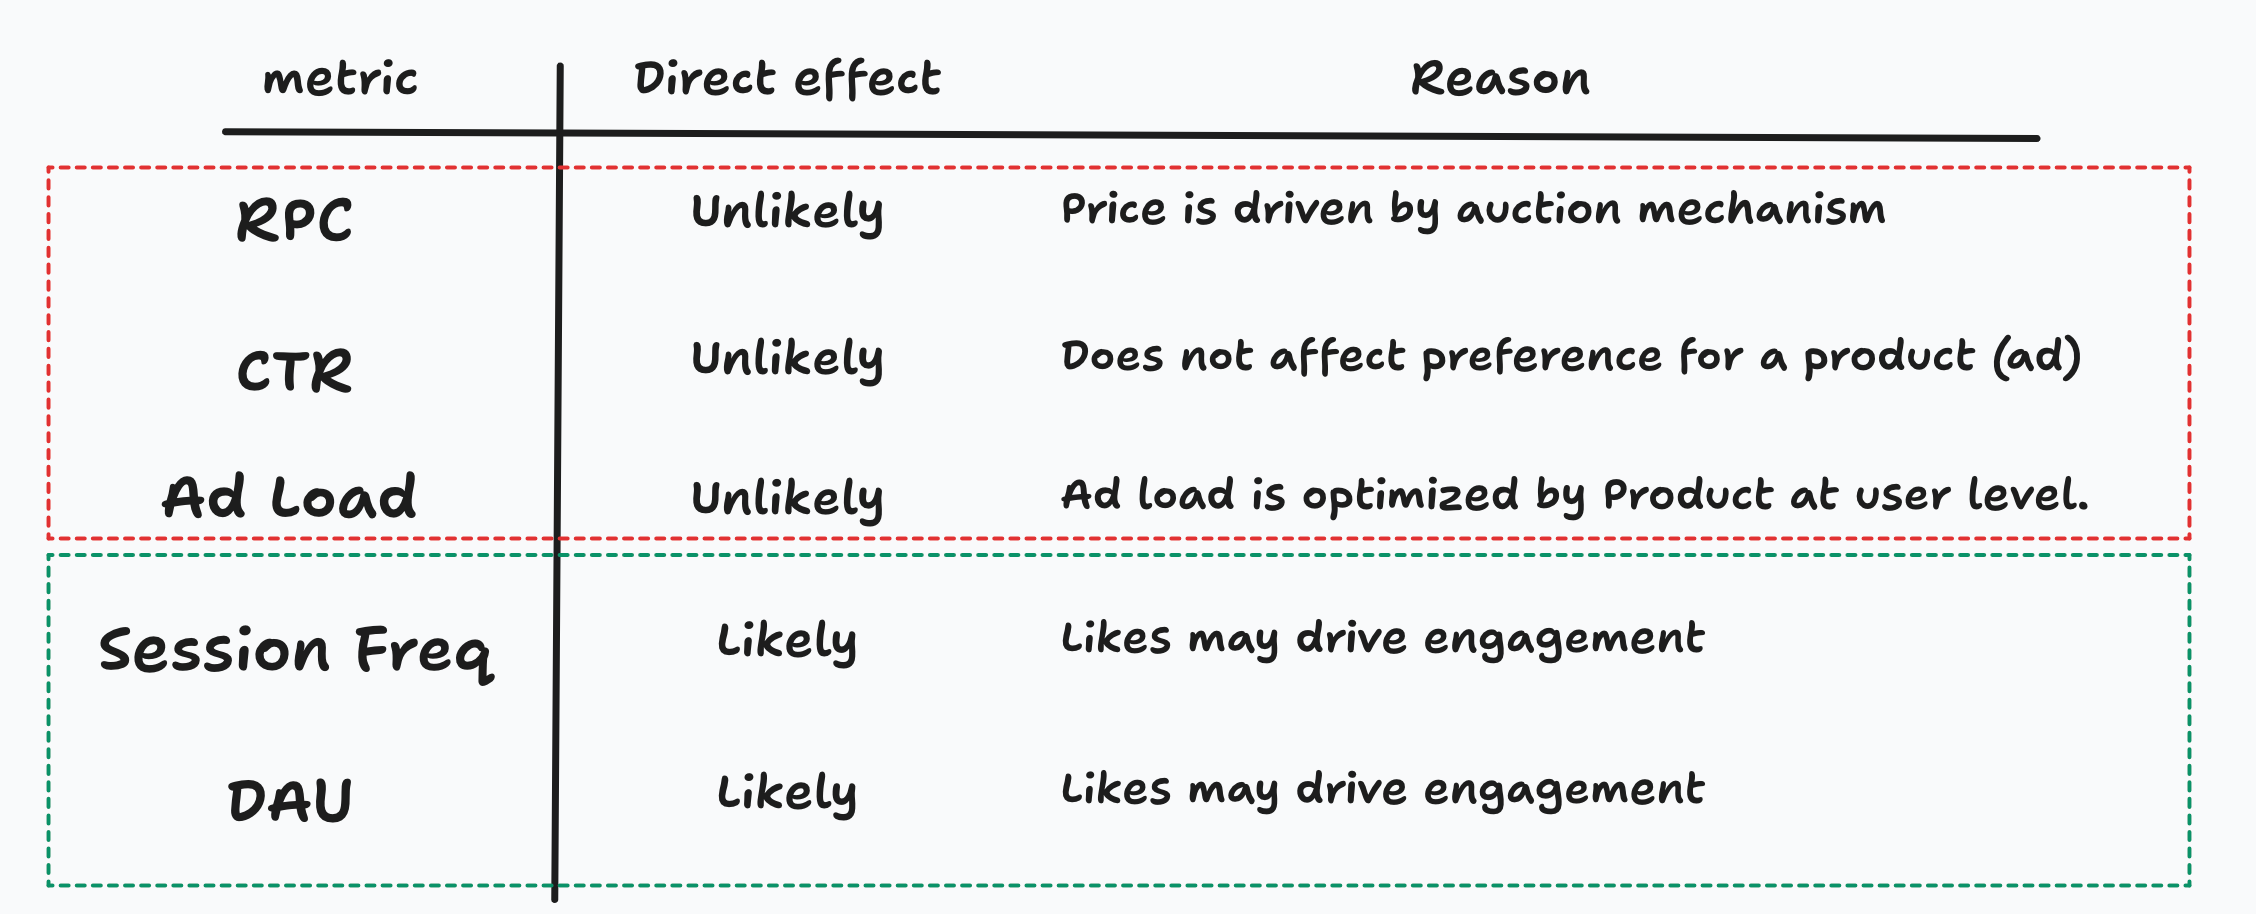
With this in mind, we can formulate some behavioral hypotheses to test that go hand-in-hand with each submetric.
Hypothesis 1: Likes as a signal for content consumers
A social network can feel overwhelming at times and this might create friction for users who would like to consume some of this content. Likes can help organize this content, improving the overall experience, driving engagement and thus, session frequency, DAU or time spent. Alternatively, posts that aren’t favored can be avoided, improving the overall satisfaction levels.
Hypothesis 2: Likes as a signal for content creators
Likes are direct feedback for content creators, who can iterate and improve the quality of their posts (the underlying assumption is that creators want more likes and more followers). This should also drive engagement up and impact the same metrics as before.
There are many other hypotheses (including some with unintended consequences because of mental health issues and network effects), but the point here is merely to showcase the methodology. Thanks to the decomposition we have already pinned down the metrics that seem to matter for the new feature, and writing down the exact hypotheses helps us double-check our logic, and even iterate on our decomposition.3
Scenario 2: how can we drive up a metric?
It's not uncommon for Product teams to struggle to demonstrate business impact. While well-intentioned, new features often aren't closely tied to key metrics. Ideally, teams should know their metrics—perhaps even own them—and design with those metrics in mind.
I’ve found that decomposing metrics helps pin down which metrics should be owned by different teams. For instance, it makes sense for the Ads Tech team to own the pricing metrics (RPC), while the click-through rate might be shared across different teams like Product Engineering (ranking and recommendations), Ads Product or Ads Delivery. Formalizing ownership ensures that changes are born with the right success metrics in mind.
Warning: a decomposition is not a model
While the decomposition is mathematically true, it’s good to remember that a decomposition is not a model.
A decomposition is not a model.
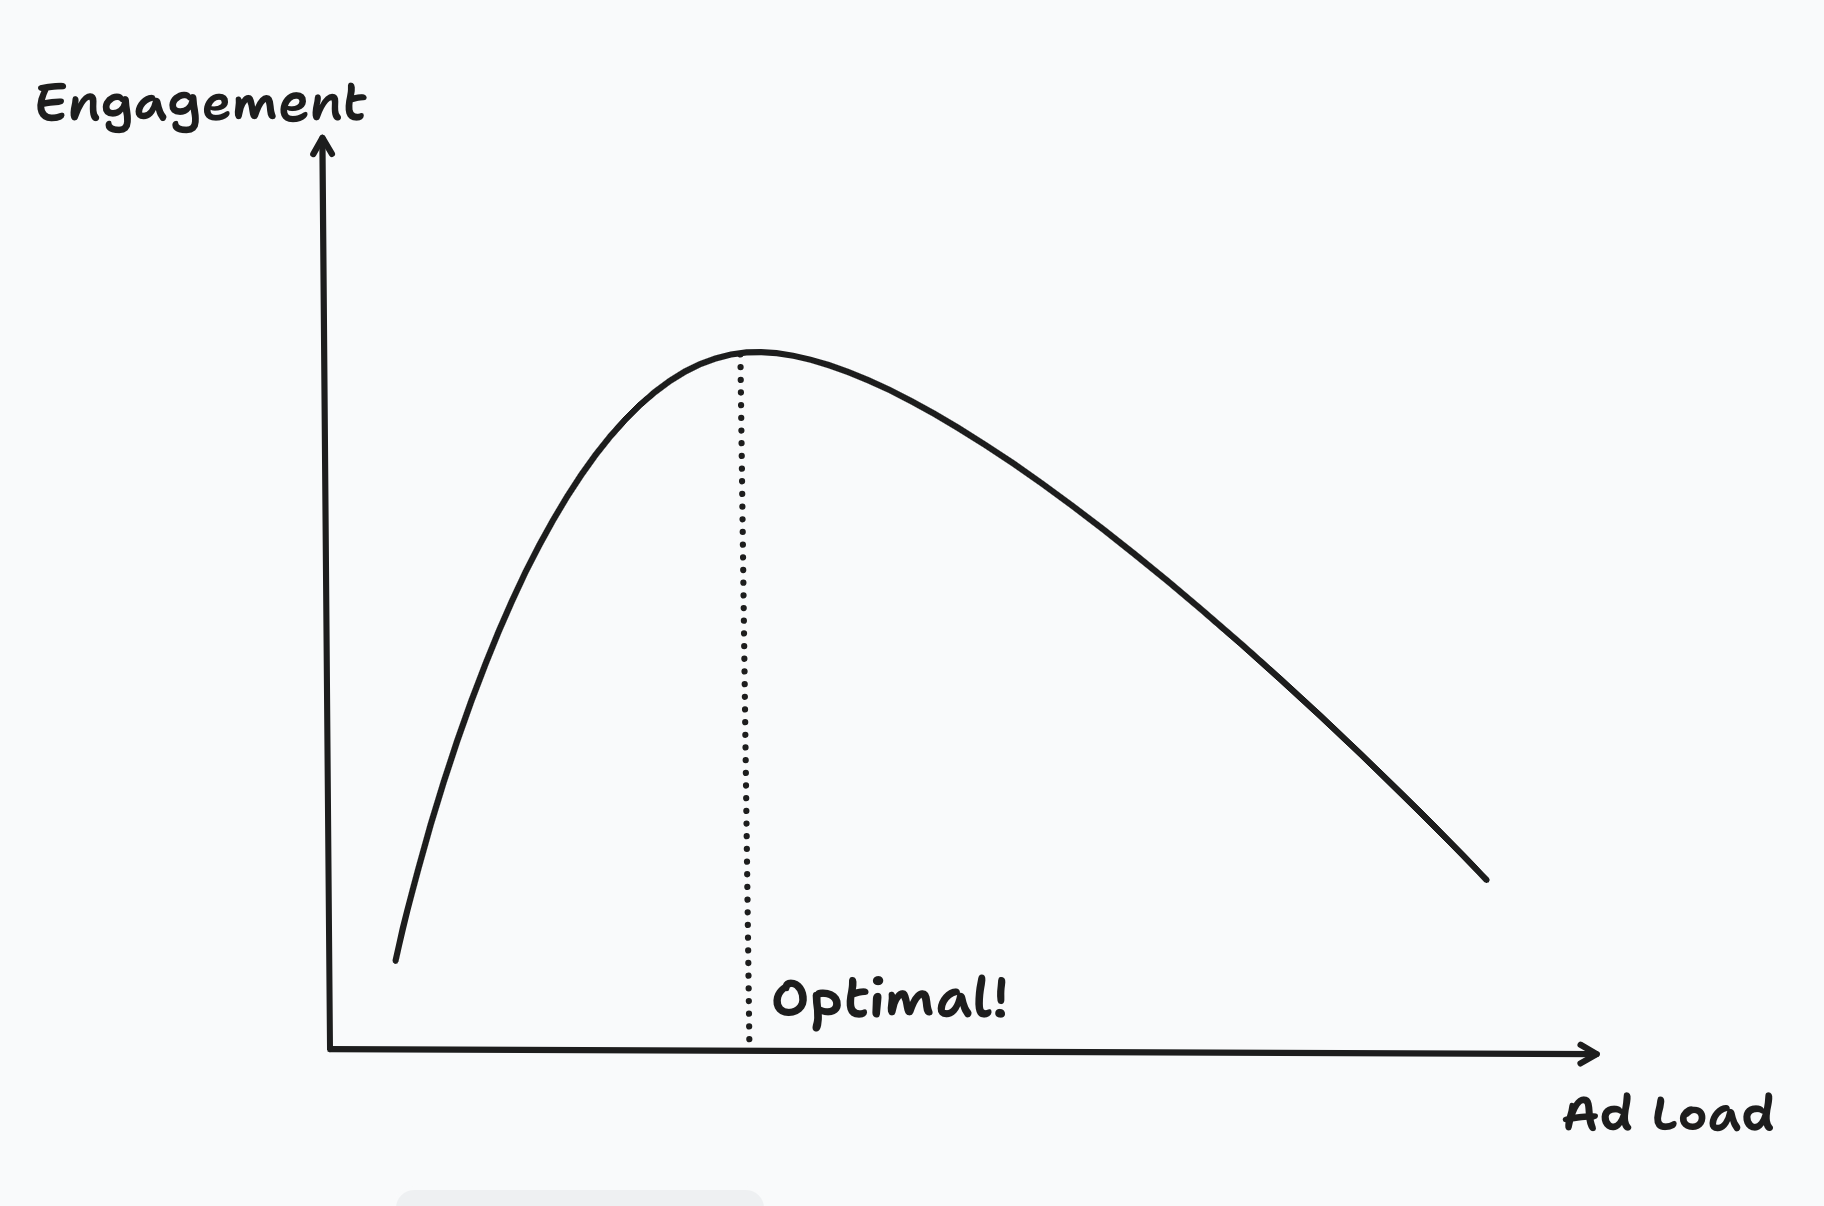
To see this, note that everything on the right-hand side enters multiplicatively. Viewed prescriptively, it follows that the company should increase Ad Load (or any of the other submetrics). But why stop there? We should actually clutter the UI with ads!

What seems to be off is that we failed to model user behavior. The next figure shows a simplified model for user engagement where there’s an interior optimal ad load (so cluttering is no longer optimal).
This leads to a more complex equation, but one that can strengthen your product intuition:
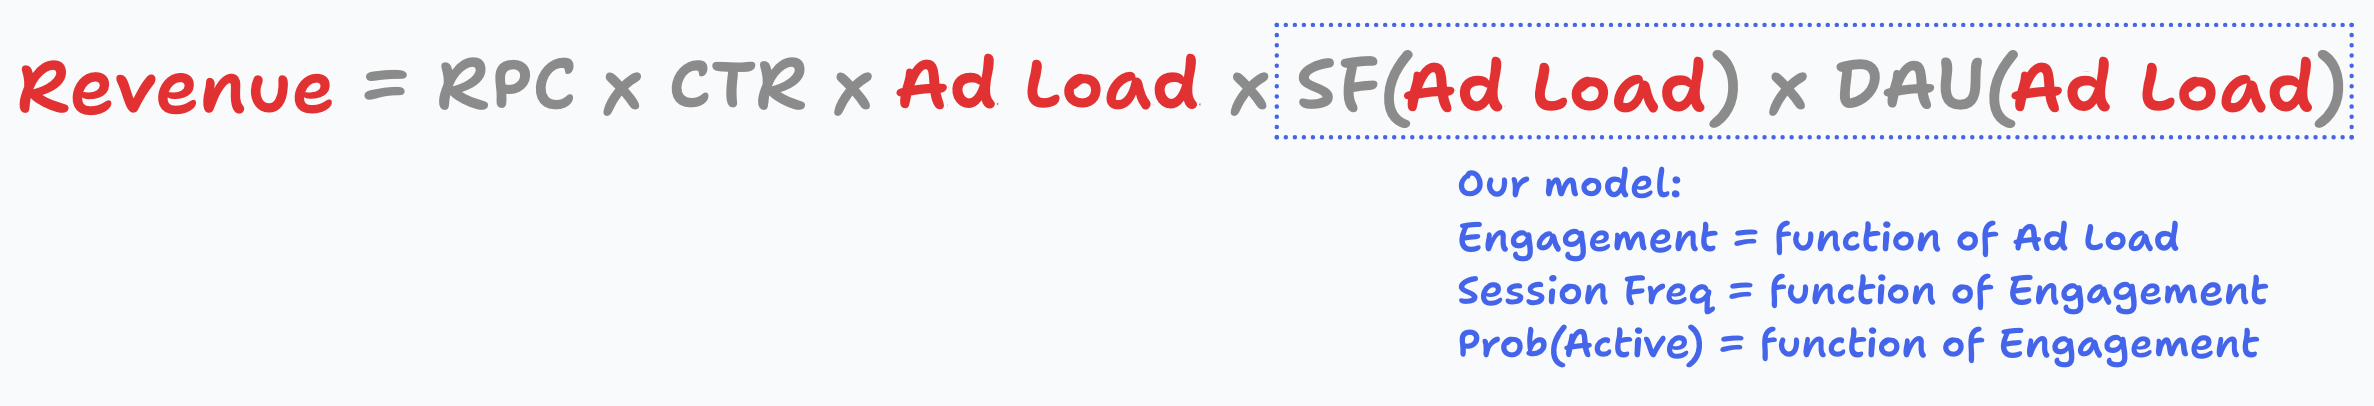
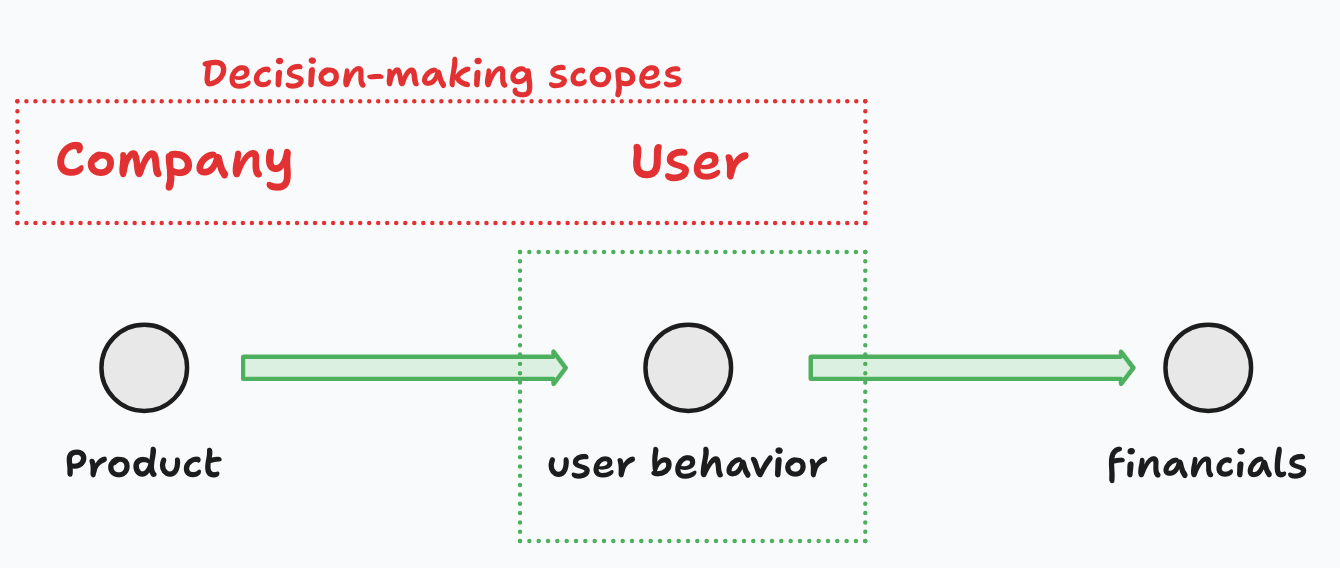
A good decomposition breaks down a metric—such as a financial one—into more actionable submetrics. But the decomposition itself says nothing about the decision-making scopes, and it’s critical that you recognize this from the outset. A useful rule of thumb: product drives user behavior, which in turn drives financial outcomes. User behavior needs to be understood and modeled.
What next?
The tricks for metrics decomposition are relatively straightforward, and the math requirements are very basic. For instance, why did I choose to multiply and divide by the number of clicks, sessions, time or users, instead of any other KPI I know about? The answer is that I almost knew from the beginning what I wanted to get, so I just tried a couple of things until I found the right expressions. But this takes practice.
Many times you can just look at the financial metrics that are frequently presented, and immediately realize how to decompose the metric. Other times you just know because you’ve applied similar tricks with different problems.4
Once you make this part of your toolkit you’ll find that you use it constantly, and even mix it with other things like causal graphs and the like. I’ll save this conversation for another post.
The more common metric is cost per click or CPC which, absent any other costs, matches RPC very closely.
What about evaluating the impact of a revolutionary Dislike button? Instagram thinks this is a good idea too.
You can augment the decomposition to include average session duration.
Economists know that revenue is price times quantity, and this is very similar to what I did with ad revenue. Revenue = (Revenue / Units sold) x (Units sold) = Avg. Price x Quantity.