
The Analytics of Marathon Running


TL;DR
In this post I analyze running data, with the objective of finding optimal training plans for running a marathon.
I first show you how to use tricks from the metrics design toolbox to decompose the main metric (time) into submetrics with better properties.
I then correlate some levers, such as weekly volume, different workouts, and tapering strategies, with my own running data.
I end discussing the gap between the current dataset and an ideal dataset that could be used to find optimal training plans.
Note: this is not a post about running, but rather, it’s a post that uses a very specific example, that’s also close to my heart. If you’re just interested in the analytics part, I hope you find the example useful.
Introduction
I picked up “semi serious” running a little bit more than three years ago, when I decided to move away from running on the treadmill to running marathons. So far I’ve run three marathons, and I’m currently training for my fourth, which will take place in a couple of months. This will also be the first time I run more than one marathon a year.
If you’ve read some of my previous posts or books, you’ll know that I like to think about how to make evidence-driven decisions. In this post I’ll try to mix these two passions, and showcase some techniques that you may find useful in your day-to-day tasks. I’ll be using data from my Garmin smartwatch. In the next section I’ll quickly describe how to download the data if you also own a Garmin watch, but I suspect that the process won’t be that different if you own a different brand.
Downloading your data
Garmin stores a lot of data from your daily activities, and you can get a hold of all of it, or alternatively, you can just manually download the specific data you want to analyze. I have created a short video explaining the second option, where you just need to log in to Garmin Connect, and download a csv file with the running events in just five easy steps:
Create an account (and sign in to it)
Go to Activities >> All Activities (on the left margin menu)
Click on the Running icon to only keep running data (you may have other events, like your weights session, etc.)
Scroll down to ensure that all of your data is loaded on the screen [this is very important!]
Click on “Export Data” on the top-right of the web page
What type of data can you find?
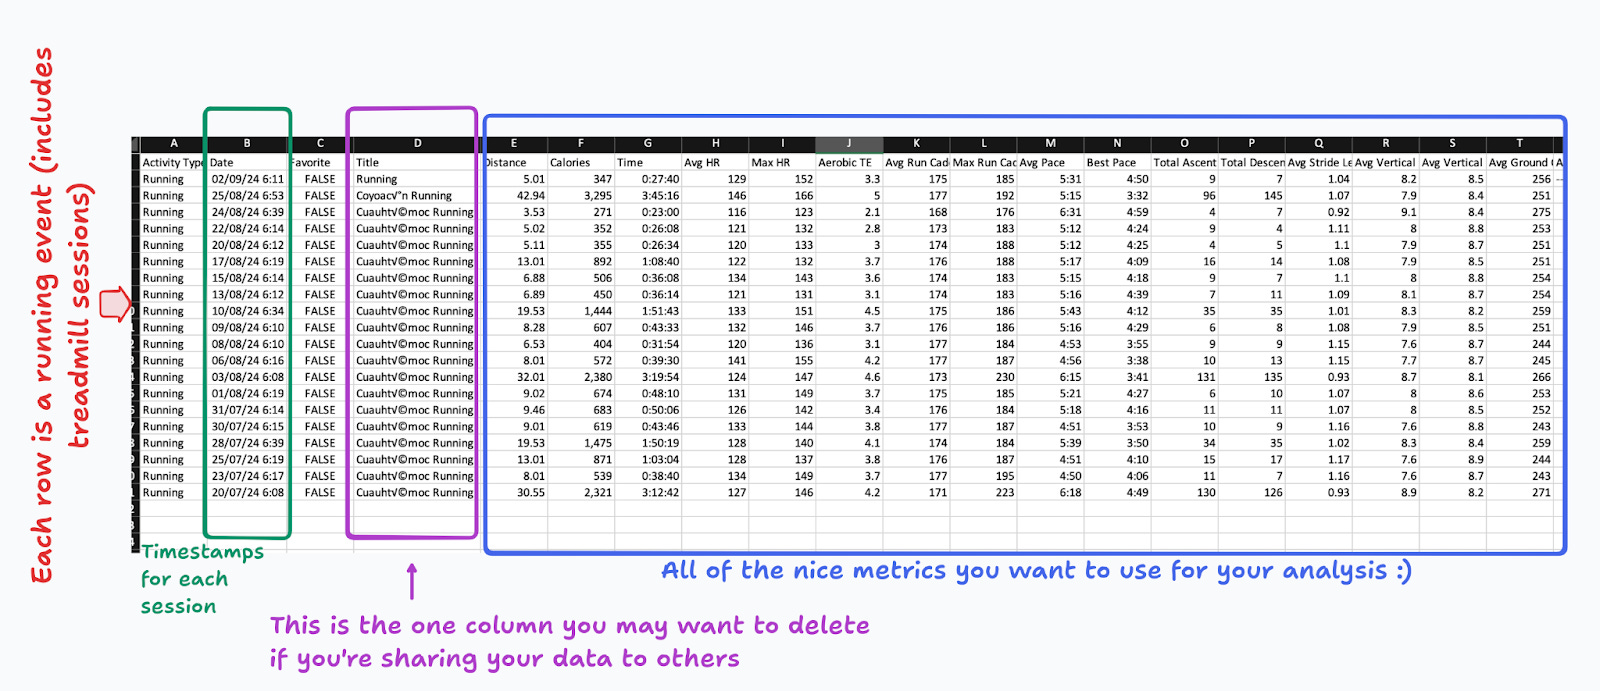
The csv file contains tons of information. I can only see mine (see the snapshot below), but my guess is that depending on your watch, more or less of these metrics will be available to you.
Each row in the dataset corresponds to one event logged into your Garmin when you started a session using your watch. You can find a timestamp and many metrics. I just want to point out one column that you might want to delete if you’re sharing your information to third parties. In general, the dataset contains no personal information, so it may look like a pretty safe data set to share. For instance, this data contains no demographic or location information about you or your whereabouts.
Nonetheless, ever since the Strava data breach scandal, it’s better to double check and drop any information that might make you suspicious. If you look at the Title column, you’ll see that each event has a label. By default Garmin provides a label that includes some information about your location. For instance, you can see that most of my events have the label “Cuauhtemoc Running”, indicating something about the municipality where I run. Many runners actually edit this label (eg. “Hill Repeats”), but if you’re like me, you may have some of these default labels, and you may want to delete the column if that makes you feel more secure.
Please take some time exploring each of the columns in the data set to ensure that no other Pesonally Identifiable Information (PII) is there.1
Guiding the analysis with some metrics design
I will guide my analysis by first performing some metrics design on the key metric that you may wish to optimize.2 Most runners fix the distance (eg. a marathon, or ~42.2 km), and aim at completing it as fast as possible. As a first step, let’s decompose this metric as the product of average pace and total distance:
This first decomposition tells us that if you want to make a new personal best or personal record (PB/ PR), you need to train to keep a desired average pace for the full distance. Easy peasy, right? Well, unfortunately it’s not that easy, since your pace depends critically on the distance.
For instance if you want to break the current world record for a marathon (2:00:35, by the late Kelvin Kiptum), you need to keep an average pace of 2 minutes 51.47 seconds per kilometer (or run at a speed of ~21 km/hr). The chances are that you will only last a few seconds at this pace, unless you’re a really experienced runner.3
Just in passing, this decomposition explains why runners use “pace”, instead of the arguably more intuitive “speed” metric (which is just the inverse of the pace). If you care about optimizing the time, the most direct metric is pace rather than velocity.
Let’s take this first step further, and continue finding submetrics that we may try to optimize for. Consider the following extension:
It now follows that to achieve faster times you need to improve your average cadence and stride length: runners with a higher cadence are able to generate more steps per minute, and a longer stride allows you to cover a longer distance per step.
I’ll now try to get a measure of running efficiency. Generally speaking, efficiency can be measured as the ratio of the output to inputs, or for a fixed input:
There are many ways to think about this problem in long-distance running, but for the sake of simplicity I’ll say that the singlest unit of output we can easily measure is a step, or a stride.4 What do we need to create one step? Many things, of course (motor control, balance, focus, etc.), but at the highest level we need energy. The energy systems are complicated enough, and unfortunately they’re also hard to measure with a smartwatch, so I’ll just use a heart beat as my input metric:5
Using this proxy, a runner is more efficient if she can produce a higher cadence per unit of heart rate (beats per minute). An alternative way to write this out is:
which you can of course plug into our previous decomposition, and obtain more submetrics to optimize for. Notice that to sustain a higher cadence for a long time you either need to exert more effort (as proxied by the higher heart rate) or become more efficient at converting this effort into strides. In long-distance running it’s customary to aim for the latter, allowing your aerobic energy system to kick-in with full power.
Just as I found a way to reexpress cadence in terms HR and running efficiency, I could do the same for stride length, itself a function of vertical oscillation, which is another metric reported by some smartwatches. You may remember from your highschool physics, that the length of one stride depends on the (initial) velocity and the angle for the stride. An analogous formula can be found for the maximum height, and from these two we can show that the ratio of is a function of the angle only. Some smartwatches report vertical oscillation and vertical ratio.
I won’t keep expanding the decomposition, but I do want to stress the point that how far you want to take it depends critically on whether the new submetrics have better properties than the alternatives. Top properties I care about are how actionable the submetrics are (whether I can find levers that directly affect the submetrics) and how “measurable” they are. For instance, I may find that running efficiency and vertical oscillation are more actionable, but depending on my smartwatch, these submetrics may not be available to me.
Running efficiency and running economy
As noted, the proposed metric for running efficiency is the ratio of the cadence to the heart rate. The good thing about this submetric is that both inputs are available in many smartwatches, so you can readily compute it. But it’s a controversial choice because a heart beat isn’t really an input.6
A metric commonly used in the literature is running economy (RE), defined as “(the amount of) oxygen (required) to cover a given distance at a fixed speed” (Magness (2014)). I will now use one of the tricks in the metrics design toolbox to arrive at a formula that allows me to compare these two measures:
This equation shows us how the two metrics compare with each other, and specifically, that running economy is proportional to the suggested running efficiency formula. To translate one into the other we first need to be able to compare the outputs (general “distance” instead of a unit distance metric like a stride), and then find a way to convert the “inputs”, (by way of oxygen pulse, that measures how much oxygen is consumed per heart beat).
Many times we can’t compute the ideal metric we want and we need to use proxy metrics. This shows that my running efficiency metric is a proxy for the arguably better economy metric. How noisy it is depends on the variance of oxygen pulse during a race.
What explains the difference between men and women?
Before digging into my data, I want to showcase with a concrete example what type of things can be done with this decomposition. The next figure shows world record paces for men and women for some selected distances, as well as their ratio (plotted on the right axis). I’ve always found it noteworthy that men are ~10% faster than women across all distances.
There are many things that may explain this difference, ranging from physical differences to pacing strategies, but here I just want to use the decomposition to test one specific hypothesis that may not be obvious at all.7
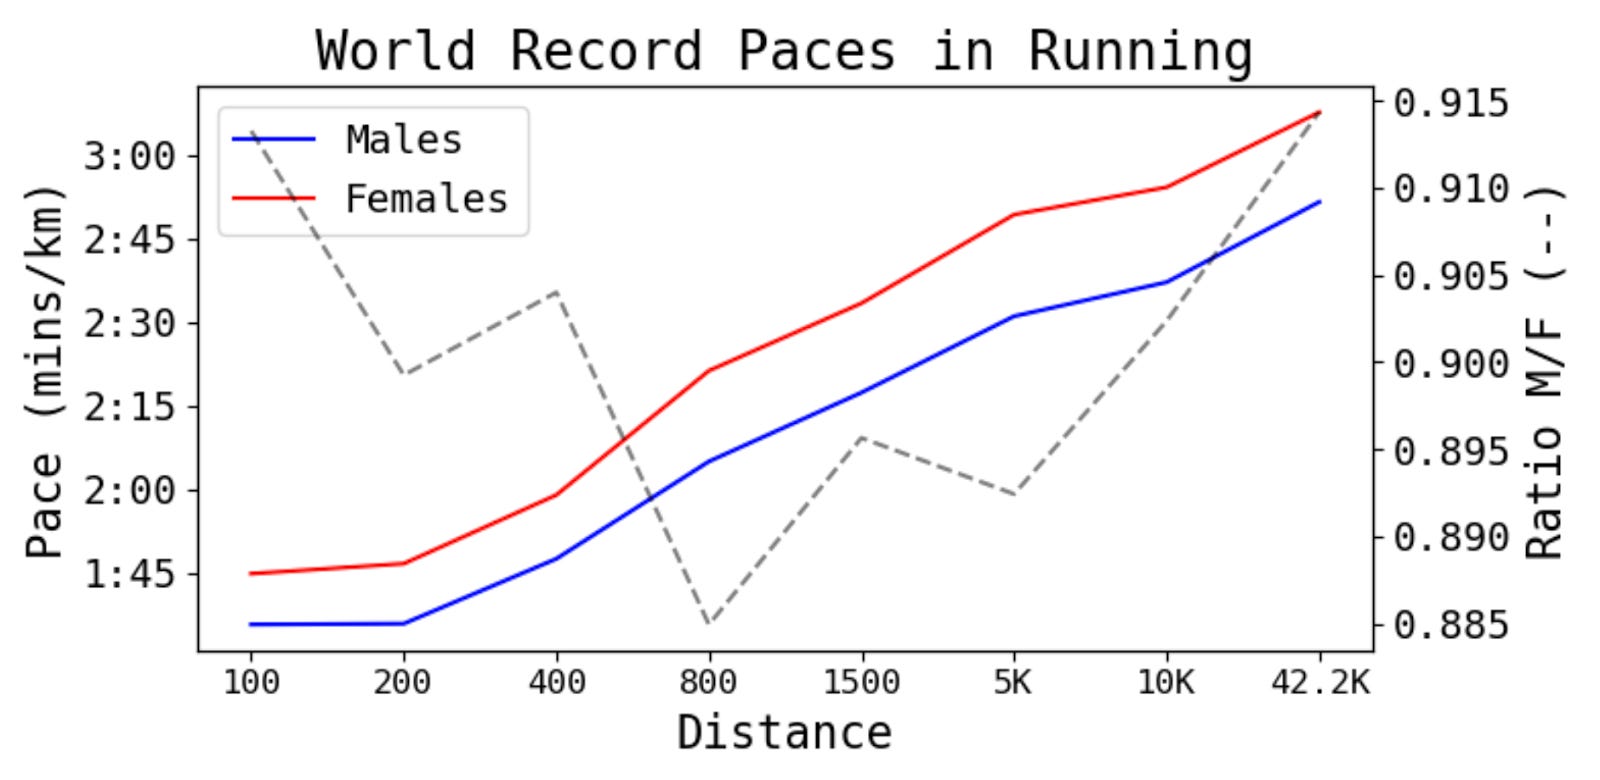
I want to see if it’s logically possible to explain this difference out just from differences in stride length due to differences in height. To be sure, I’ll assume that there are no differences in cadence, and that a runner’s stride length is proportional to their height, which allows me to arrive at the following expression:
Using data I found on Wikipedia, I find that the median ratio of females to males height across countries is ~0.93, which is very close to the 0.90 ratio in paces.
What can we conclude? This analysis shows that, under my assumptions, differences in paces could be mostly explained by differences in heights. To be sure, I’m not claiming that this is indeed the sole cause for the differences in pace, but rather that it’s logically possible.8
A first look into my data: output metrics
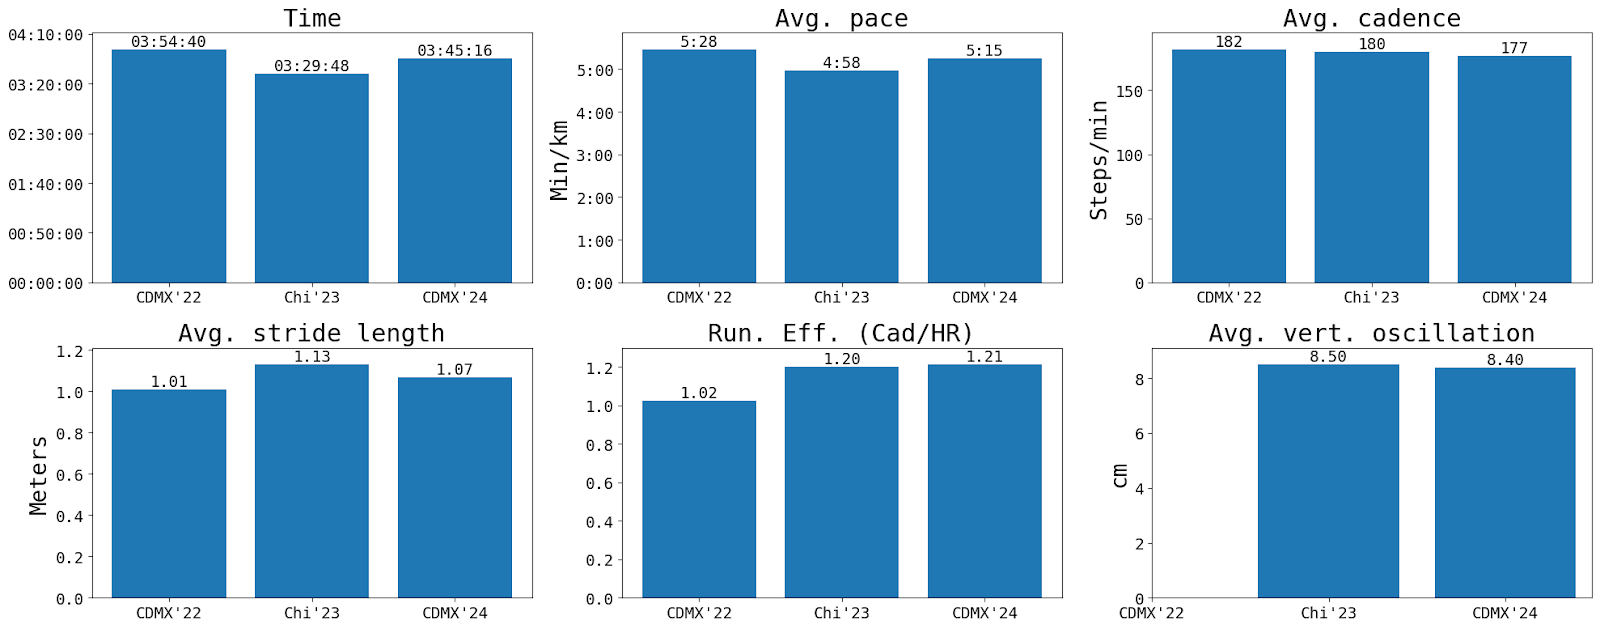
Figure 1 shows the key metrics for the three marathons I’ve completed to date. The key insights are:
The best race was the Chicago marathon, completed in just under 3 hours and 30 minutes.
This was driven by a faster pace of 4:58 mins/km.
The faster pace appears to be explained mainly by a longer stride, and better running efficiency.
Unfortunately, my Garmin only started to record average vertical oscillation after some software update that took place after the first marathon, so I can’t say anything about how this impacted performance.
Figures 1: Key metrics for three marathons
So what?
Up to now I’ve only been able to understand some of the key metrics that Garmin records and reports, and its relationship to the main metric that I want to optimize (time). This is the descriptive stage, and as such, not much value has been created (other than “understanding”). What I really want to find are recipes for success, or playbooks to achieve better times. This is the prescriptive arena.
I’d love to answer questions like (from the more abstract to the more specific):
How can I improve my running efficiency, effort and stride length, and sustain it for the length of the race?
Given my age and gender, what do I need to train, and how should I plan that training, to achieve a specific time? Say, if I want to qualify for Boston, what do I need to do?
What is the optimal tapering schedule?
What is the optimal weekly volume (mileage, or total kilometers per week) so that I achieve my time objective, without getting injured?
How should I mix different training sessions, such as sprints, hill repeats, threshold and long runs?
To move to the prescriptive stage, I need to understand which levers are available to move these submetrics, and to calibrate them. The latter is usually done by way of the predictive stage.9
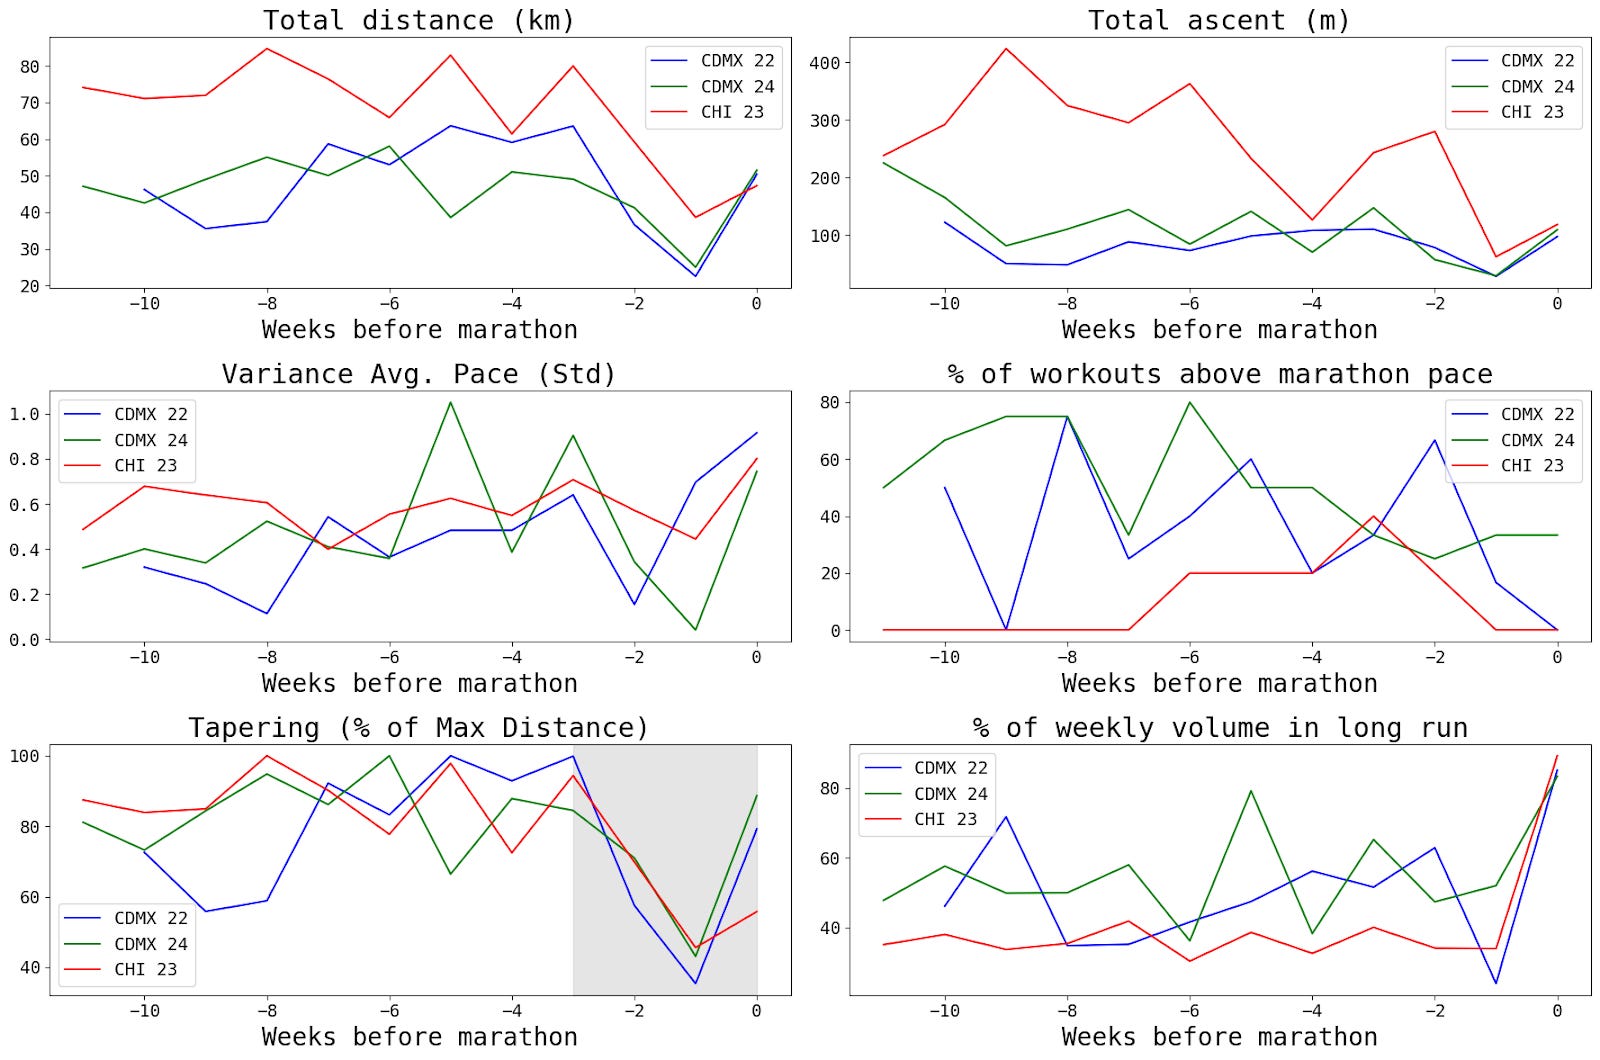
In the next figure I show how several potential levers correlate with marathon times. To summarize, I find that:
The best marathon time was attained when:
Volume: weekly mileage was the highest
Hill repeats: total ascent was the highest
Speed: the percentage of weekly workouts with faster-than-marathon pace were lowest
Long run weight: the percentage of weekly volume that was run in the longest workout (“long run”) is the lowest
The variance of average pace doesn’t appear to be important, though this variable appears to be a bad proxy for different speed workouts. Similarly, there doesn’t appear to be enough variance in the tapering metric to find signal.
The ideal dataset
With the current dataset it is hard to achieve much more. Before explaining why, let me summarize what was done:
I decomposed the main metric (time) into submetrics that have better properties, and in particular, that are more directly actionable.
Using my own workout-level data, I found some correlations between some levers and the key metric.
While this might seem like an improvement, I’m far from being able to answer the questions posed in the previous section. For instance, I know that more volume and variance in the weekly workouts may help explain the better performance in 2023. But I don’t know which one has more weight, or how to mix them.
My real aim is to find a function that looks like this:
Here, y is one of the submetrics found earlier, and f is a function that converts inputs into these submetrics. Broadly speaking, individual performance will depend on genetic factors, changes in the training plan (the levers), and other variables that are hard to include (altitude, nutrition and hydration,etc.).
It’s natural to wonder whether one can possibly find such a function, and you may recall that in a previous post I suggested some avenues to do so. I won’t repeat myself here, but I’d just want to finish by suggesting that one of the most important questions we need to ask ourselves is what type of dataset would allow us to learn that function.
At a first level there’s the problem of sample size. While I have more than 300 workout events logged by Garmin, the actual dataset has only three observations, one for each one of the races I’ve decided to analyze. So at this point, I’m restricted first and foremost by sample size. How large is the ideal dataset? It’s hard to say, but in principle, the larger the better. I’d have to start running way more marathons than my body can accept, to collect such a dataset (or convince some fellow runners to share their own data).
But evidence-based decision-making — as opposed to data-driven decision-making — is not only about having “more data”, but rather, it’s about having “better data”. One way to measure the relative goodness of a dataset has to do with the variance of the features. Take the tapering example. In the figure above you’ll see that I’ve used essentially the same recipe for tapering across the three races: peak around four weeks before the race, and then gradually reduce the volume (but not the intensity, though you can’t see that in that figure) until race day. Even if I had a larger dataset, if I always use the same tapering strategy, I won’t be able to find the “optimal one”; there’s just not enough variance in there.
But variance is still not enough. Ideally I’d love to have independent draws of different levers, so as to avoid selection bias. Imagine that I indeed have a larger dataset, with events logged by many runners, but these runners follow training plans that their coaches select for them. This is a classical example of selection bias, and I’ve already discussed elsewhere some of the problems that arise from this.
So these are the three key ingredients needed if I want to seriously try to improve my running through evidence-based decision-making:
Sample size
Variation
Independent variation
I’ll leave it here, but I hope to keep exploring running data in the future.
It’s tricky to know if your dataset has PII. Here’s it’s not difficult to identify a runner if you combine this dataset with some other public information, where you’ll then find names and age groups.
Chapter 2 of Data Science: The Hard Parts explains these techniques in detail.
As I’ve described in Analytical Skills for AI and Data Science, feeling comfortable with simplifying a complex problem is a critical analytical skill.
The idea is that, at the each heart beat is used to pump oxygen that eventually gets into the muscles, where the aerobic “engine” kicks in to produce energy.
Think of an internal combustion engine, where the input is gas. Heart beats are more similar to revolutions per minute than to the actual volume of gasoline.
The next step would be to challenge the main assumption that stride length is proportional to height, and that this factor is the same for men and women.
Analytical Skills for AI and Data Science describes at length each of these stages.