


Levers as features in ML models
Doing optimal decision-making by simulating alternative scenarios with ML


TL;DR
Levers are objects that you choose, but levers may also be features in your machine learning models.
If you only care about making the best predictions possible, you should include the lever, whenever it’s correlated to any other feature; this is the classical omitted variable bias.
If you care about making better decisions, you can actually use ML to simulate alternative scenarios, and choose the one where the the objective function is optimal.
The endogenous character of levers create some subtleties that causal inference aim at controlling: specifically, you need to care about selection (confounding) bias.
You can find the code for this post in the Github repo.
Introduction
In the past I’ve made the argument that viewing prediction as an input for decision-making will help you find machine learning (ML) use cases with substantial value creation potential. There are many ways you can transform a prediction into a decision-making problem, but here I’ll just focus on the case where a lever is a feature in your ML model.1
Just as a reminder, a lever is something that is chosen by you with the objective of achieving some goal. Levers abound in real life: you may choose your diet or calorie and water intake, hoping to achieve some health goals. You may choose how many hours you sleep to achieve a desired productivity and anxiety levels. In company settings, you choose the features of your product, its pricing, the advertising budget, and the company’s culture to achieve certain predefined goals.
Mathematically, I’m considering the following supervised ML setting:
Where y is the outcome you wish to predict, l is your lever and X is a set of features, excluding the lever. The goal of the data scientist is to use the training data and a prediction algorithm that can learn the function (f).
When is this setting interesting?
This setting is particularly interesting when the outcome you want to predict is the goal of your decision-making problem. To be sure, note that including a lever as a feature helps you achieve two objectives:
Enhanced prediction performance: since a lever impacts the outcome metric by definition, a data scientist who cares only about prediction error, should always include the lever as a feature, if available.
Improved decision-making: if you learn the right prediction function (
f), you can use it to make decisions to achieve better objectives.
I’ll expand now on the second point, because it is at the crux of the argument I want to make. Suppose you want to predict your revenue in the next quarter (y), depending on your unit price (p). If you have an estimate for the function, you may conclude that:
Faced with these two options, you choose the latter unit price of $23.99, since you expect to get better financial results with this price. Whether your choice is optimal or not depends on the quality of your estimate.
I now summarize the process I’m describing.

Note that fhat() is only used to simulate the outcome under different choices for the lever, but the actual result depends on the true, unobserved, data generating process.
Selection on observables
There’s an important asymmetry in the data generating processes (DGP) for the outcome and the lever. On the one hand, nature chooses the function (f), meaning that you can take it as fixed. On the other hand, the DGP for the lever is chosen by you. You can decide to base your pricing decisions on the weather, on your mood, or on the stock market. It can literally be anything you want. And this creates some subtleties that are important to discuss.
The most important is selection or confounding bias, which you may recall, arises when some of the features in X are part of the DGP for the lever and the outcome. We can illustrate this by making use of directed acyclic graphs (DAG). The left DAG in Figure 1 shows the standard case where X acts as a confounder for the causal effect of the lever on the outcome. The DAG on the right shows a more common scenario for the case of levers. The idea is that you assign the lever based on some type of expectation — that may not be a typical mathematical expectation, but rather, some heuristic process — of the outcome given X.

An important result in causal inference known as Selection on Observables, says that you can identify the causal effect of the lever on the outcome if you observe l and X.
Omitted variable bias
The omitted variable bias (OVB) arises when you fail to include a feature that ought to be included given the true DGP.2 While the bias is stated in terms of the parameters of a linear DGP and linear regression, for our purposes it translates into having subpar predictive performance relative to using the true unobserved DGP. From a decision-problem perspective this also implies that, depending on the strength of the bias, you may end up making suboptimal decisions.
If Equation (1) is true, failing to include either one of the features creates a bias, and the magnitude of the bias depends on the impact of the omitted variable on y, and the covariance of x and l, Cov(x,l).3
Note that there might be an OVB with or without causal effects, it only matters that the features are correlated, even if spuriously. Take the following DAG, where x and l are independent, conditional on controlling for the third variable w (you can verify that there’s OVB in the code).

Examples
Before moving on, I want to ground the conversation with two examples. The first one involves underwriting models where the aim is to predict if a particular individual or company will default on a loan. Based on this prediction, financial institutions decide to offer, or not, a credit card or a loan. The second example has to do with a model that predicts if a specific communication sent to a customer will be read or not.
Underwriting models
Banks use underwriting models to estimate the probability of default, itself used to grant loans to potential customers. For instance, when you apply for a credit card, the issuer makes a prediction using any available data, such as your income, credit score and any other debts. There’s a very robust industry that aims at identifying and measuring the traits that can help distinguish “good” from “bad” debtors (e.g. the FICO score).
Going back to the mathematical formalism, the probability of default (d=1) depends on some variables (X) and a lever. Here I’ll posit that the interest rate (i) – chosen by the bank, hence a lever – also affects the probability of default.4
Choice of a communication channel
Many marketing teams care about the open rate, a KPI that measures the fraction of sent communications that were actually opened. Three levers that can be used to optimize the open rate are the timing and content of the messages, and the channels used (eg. SMS, Whatsapp, email, etc.). If you were able to train a model that uses some other features, as well as any of these levers, you might attempt to convert this prediction model into improved decision-making.
From casual effects to prediction (and decision-making)
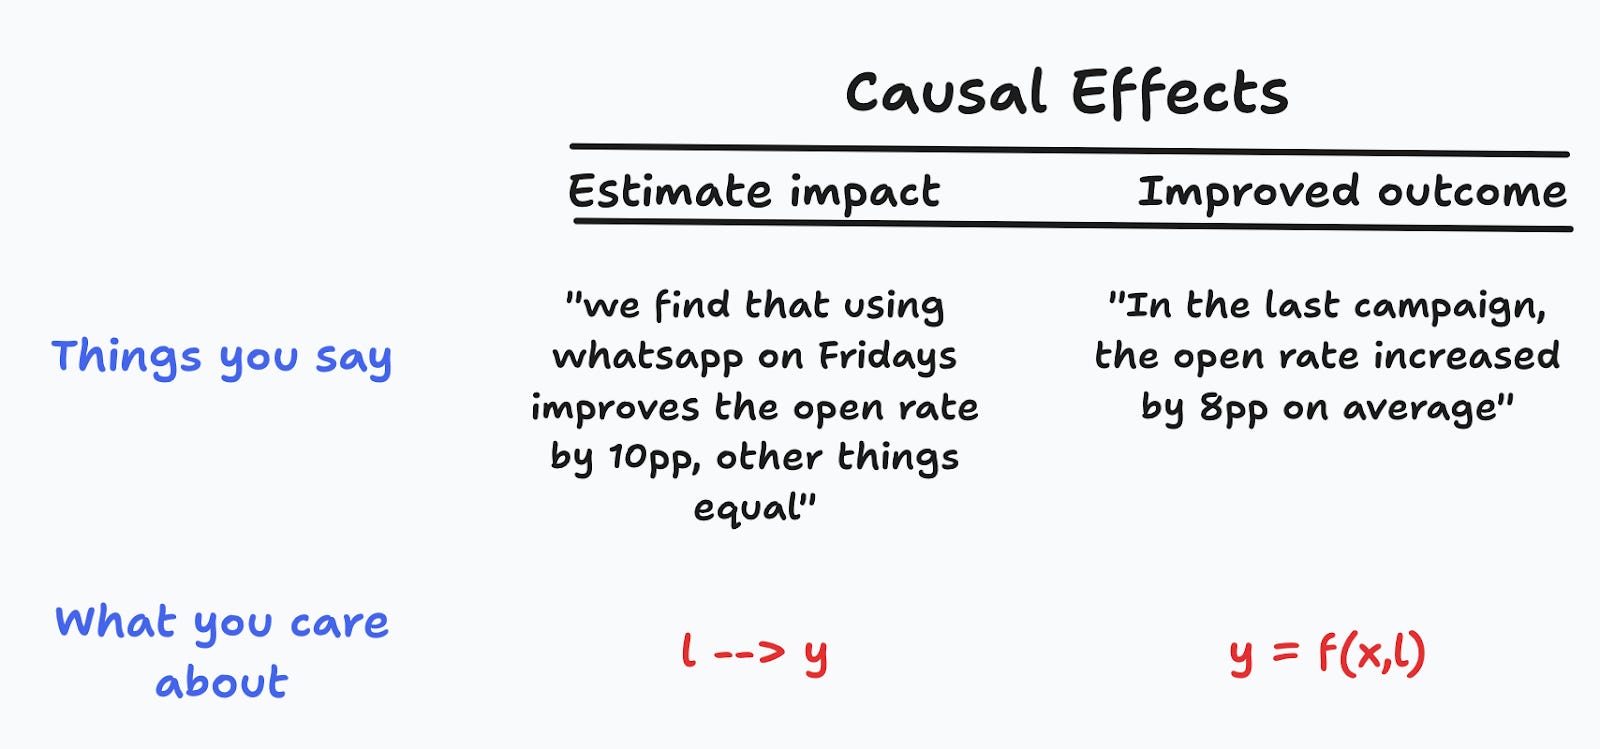
Many times, when people talk about “estimating causal effects” they mean quantifying the impact of some variable on some outcome. Their focus is on learning the causal mechanism, and not necessarily to become better decision-makers. While this is most common in academic circles, it’s also not uncommon to see this in the industry.
On the other hand, with improved decision-making, your focus is mainly on the outcome, and the specific effect of the lever is only of instrumental interest, meaning that you may care about it for future decision-making, for interpretability or storytelling purposes, or to iterate on your hypotheses. The next table summarizes this discussion.
A simulated example
I’ll illustrate some of the subtleties that arise naturally when you try to use ML to improve your decisions. I’ll simulate the following DGPs:
There is a binary lever that takes one of two values depending on the realization of a normal random variable. Note that when alpha_1=0 there’s no selection bias. The second equation corresponds to the true DGP for the outcome, itself a linear function of the lever and some other variable W.
By default, I make all parameters equal to 1.5
The next table shows the different scenarios I will simulate:
Random selection vs. Selection Bias
Feature selection:
Model 0: Include both features (
L,W)Model 1: Include the lever
L, but omitWModel 2: Include feature
W, but omitL
Since in models 0 and 1 the lever is included, you can also aim at using the learned function for the outcome to make a better choice. Model 2 is just included to highlight the effect of omitting the lever: with random selection, and a suitable parametrization that ensures symmetry, omitting L or W generates the same result. This won’t be the case with selection bias, where the lever will have a larger variance.

Violating selection-on-observables
I’ll first compare scenarios B, D and F in the above table. In case B, you include all relevant features, so you comply with the selection-on-observables assumption. I expect everything to behave nicely, so your prediction performance — as measured by the minimum squared error (MSE) — and decision-making should also be optimal. With cases D and F I expect to have subpar predictive performance relative to case B, and suboptimal decision-making in case D.6
The next figure shows the estimated mean OLS coefficients, as well as 10% confidence intervals from a Monte Carlo simulation. Recall that the true parameters are all one.
As expected, when there’s no violation of the selection-on-observables assumption, everything’s nice, and I’m able to recover the true coefficients (Case B). This translates to optimal decision-making.7 When you omit W, and given the right choice of parameters, the estimated parameter changes signs, and you end up making a suboptimal choice (Case D)!

The right-hand side plot shows the results with random selection. Now you can omit the lever, or W, and everything looks good (you may have larger confidence intervals, but from a decision-making perspective you’re good to go). This is an important lesson, so I’ll highlight it now:
In the presence of selection bias, if you want to make optimal decisions you should consider first randomizing your lever.
Naturally, randomization is not the only way you can achieve this. Any of the methods in the causal inference toolbox will become handy here too.
Data vs. algorithms
One common theme in Data Science: The Hard Parts is that you shouldn’t expect an algorithm to solve a data problem. In this context, I mean that if you have selection bias, it doesn’t matter if you choose linear regression, gradient boosting or deep learning: you still won’t be able to “automagically” estimate a causal effect (the data “problem”).
In the accompanying code you can check that the same result arises if you use linear regression, random forest or gradient boosting regression.
What next
I encourage you to try this with some decision that you care about. Note that if done correctly — by making use of randomization or any of the methods in causal inference — you will have changed the DGP for the lever, creating some new form of selection bias. It won’t come as a surprise that you may have to take care of this if your plan is to repeat this again.8
For other forms, you can check Analytical Skills for AI and Data Science (ASDS), and Chapter 14 in Data Science: The Hard Parts. I quickly touched upon the subject for this post in the last chapter of ASDS.
OVB is a classical result in statistics and econometrics. I cover it in Chapter 9 of The Hard Parts.
The same intuition applies with more than two features, but the covariance is expressed in terms of partialled-out residuals, as in the Frisch-Waugh-Lovell theorem. See also Chapter 10 in The Hard Parts.
I’ve found that this hypothesis is far from accepted in the financial industry, and while this is not the place to make an argument for it, I’ll keep it for the sake of a discussion.
There are two exceptions to this default parametrization: to ensure that L and W have the same signal-to-noise ratio with respect to Y in the random-selection case, I make alpha_0=0 and L_l=0, L_h=2. This ensures that Var(L) = Var(W) = 1. This specific choice of parametrization ensures symmetry and is in no way necessary. It just simplifies the interpretation of the results. In the code you can play with all of the parameters.
With this toy example it’s easy to find suitable choices of parameters such that you end up making the wrong decision. Note also that in case F, since you don’t include the lever there’s no space for making better decisions.
Since the true and estimated coefficients are positive (and equal to one), you always end up choosing the optimal high value for the lever. I don’t show this here since it’s straightforward, but you can check the code where I compute this and other performance metrics.
If there’s no model drift for the outcome, you may not need to take care of it in the nearby future.