
Finding the Right Data for Your Problem (part 1)
Granularity, variation and why data choice matters

TL;DR
Avoid the "find-me-the-problem" trap: Don't start with existing data and hunt for problems to solve; instead, start with clear business questions and then find the right data to answer them.
Variation is essential for learning: Without sufficient variation in your data, prediction algorithms can't uncover meaningful patterns—this is why understanding your data's sources of variation matters more than just having lots of data.
Know your data's granularity: Always understand what each row represents (user-level, event-level, time-level, etc.) and choose the granularity that provides the most relevant information for your specific problem.
Beware of Simpson's Paradox: Aggregating data across groups can completely reverse the true relationships in your data—you need to control for group differences to avoid learning the wrong patterns.
Think about variation sources upfront: Identify what types of variation (within-group vs. between-group) your problem requires before you start modeling, and don't let algorithms make these critical decisions for you.
Introduction
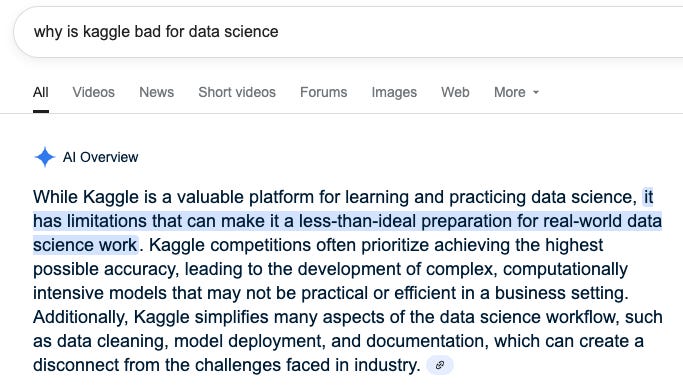
In the not-so-distant past, aspiring data scientists built their reputations from prediction competitions in Kaggle. Each competition comes with a prediction problem and an accompanying dataset, and participants try to develop the most performant solution. Not denying the positive aspects of such competitions, this structure oversimplified data scientists’ day-to-day workflows.
Previously I’ve talked about the critical skill of coming up with good business questions, but in this post I’ll cover the inverse problem of finding the right dataset for your business question.1
Find-me-the-problem pattern
An unintended consequence of the “data-as-a-strategic-asset” mantra, is that companies started taking the data they had already been collecting, and asking their data scientists to find ways to monetize it. Under this pattern, one usually starts with a dataset, and only then finds the problem that generates the most value. I call this the “find-me-the-problem” pattern, which is typical of companies without a robust data-driven practice.2
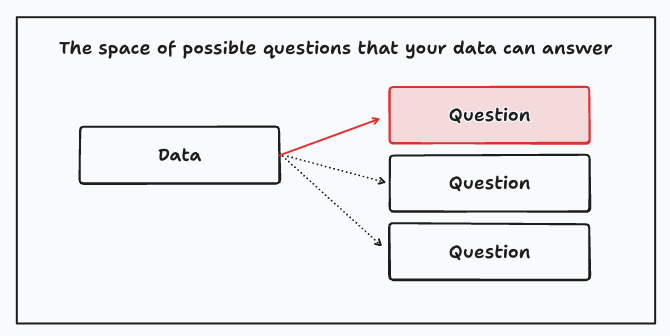
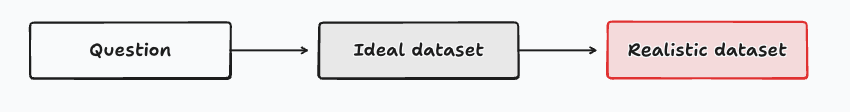
Compare this to the “find-me-the-right-data” pattern, where one starts with a business question, and only when this is well-defined, the data scientist searches for the best dataset to answer the question.
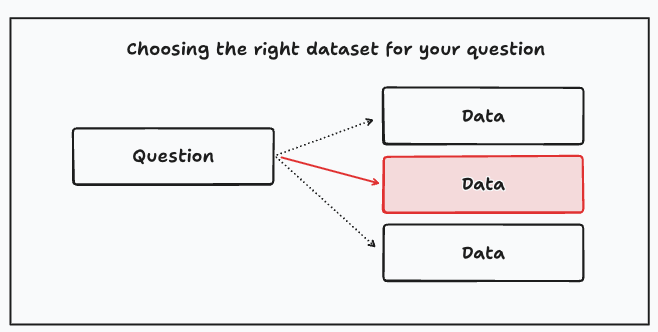
A better approach is to identify first the ideal dataset for this question, and then try to find the best realistic dataset. This way you know what you’re missing from the outset, and you might try iterating at a later stage if the value is large enough.
You don’t need to work with perfect data, but at the very least you should know what your dataset is missing.
Variation is all you need (kind of)
One key principle of prediction is that without enough variation, there’s no way you can proceed. This is most clear in linear regression where a solution doesn’t exist in the presence of perfect multicollinearity. In practice, this can be seen in two scenarios:
You include an intercept and a constant feature X.
You include two features X1, X2 such that one is a linear combination of the other.
Many students learn and understand the math3 but forget to grasp and internalize the the main principle: you need variation to learn patterns.
You need variation to uncover patterns.
At what granularity should I work
Practitioners of dimensional modeling know very well the concept of the granularity or grain of a table. In my experience, very few data scientists know this concept, and it’s super useful.4
A data scientist should always know the granularity of their data. Moreover, they should always know what the ideal granularity is for their problem.
So what is the granularity of your table? Think about what a row represents. Does it represent a unique user? Then your table has user-level granularity. Does it represent a time aggregation? Then your table has granularity at that specific time level, say month or day. Does it represent events at the user × time level? Common granularities are:
Event level (e.g. clicks on a webpage, or credit card transactions)
User level (e.g. total transactions per user for a fixed time window)
Geographic level (e.g. total transactions per municipality)
Time level (e.g. total daily transactions in the last six months)
The granularity of your training data tells you the different sources of variation that you can get from your data. For instance, a cross-section of users provides variation at the user level, a time series provides variation on the time dimension, and longitudinal data provides variation at the user and time dimension that can be exploited. Importantly, you choose the granularity that provides the most information for your prediction problem.
Choose the granularity that’s most appropriate for your prediction problem.
In textbook presentations, it’s common to use mathematical notation to be make absolutely clear the granularity of the required data for a model. For instance, the subscripts in the following examples represent a cross-section of individuals, a longitudinal dataset with user x time granularity, and a longitudinal dataset that includes the geographic dimension. This can extend further — for instance, you may wish to view your data so that gender or campaign dimensions provide extra sources of variation.
Generally speaking, thinking about the granularity of your data can help you enrich your analysis, as Simpson’s paradox highlights.
Simpson’s paradox
One of data science’s most important lessons is provided by Simpson’s paradox, as plotted below.5 Your task as a data scientist is to find evidence that increased marketing spend (X) increases sales (Y).
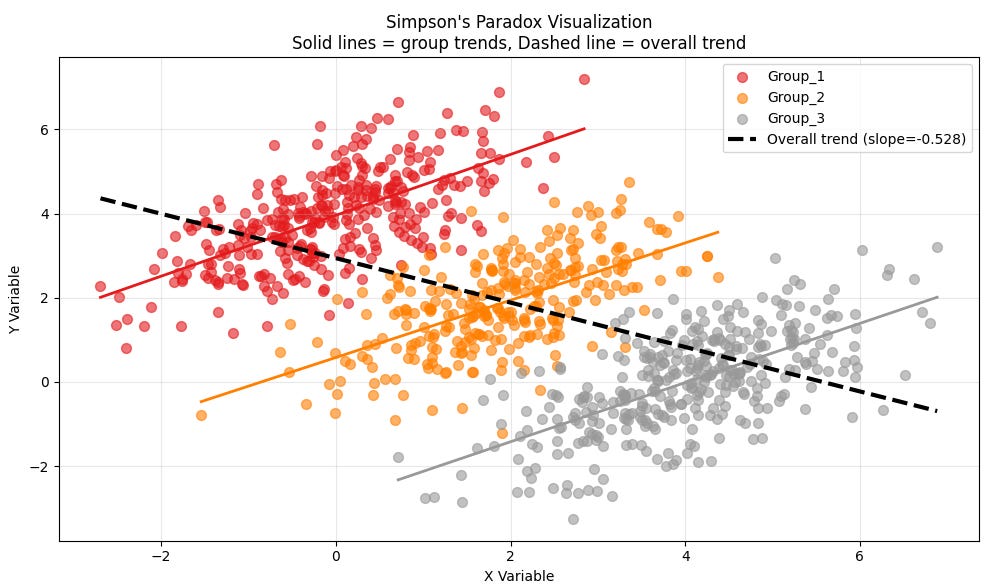
The black dotted line shows that overall sales and marketing spend are negatively correlated, an unexpected and counterintuitive result. To recover the true effect, you need to control for the differences across groups. In a linear regression setting, you can easily do that by including dummy variables that affect the intercept.
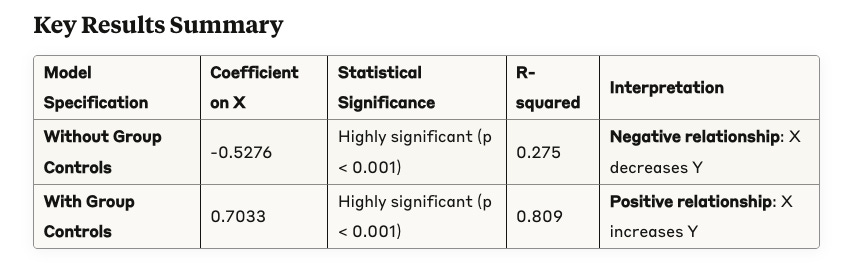
As a data scientist, you need to understand what are the sources of variation required for your problem. In Simpson’s paradox, if you don’t control for variation across groups your algorithm learns the wrong pattern.
Don’t let an algorithm choose for you the sources of variation required for your learning problem.
Variation within and between groups
The choice of a dataset defines the granularity — and the sources of variation — for your problem. As Simpson’s paradox shows, this choice can have important consequences for both your predictions and your understanding of the problem.
In this example, group-level features capture between-group variation, and individual-level features capture within-group variation. Event-level data can also introduce variation over time, which may be necessary to uncover time-dependent effects.
A common mistake I see among data scientists is including both group-level dummies and group-level means of some of the individual-level features. While this might seem intuitive, the dummies have already captured the relevant between-group variation, making the inclusion of means redundant.6
What’s next?
Selecting the right data for your problem is a critical skill for data scientists. In this post, I argued that thinking about the sources of variation in an ideal dataset should be done from the outset—even before you start working with the data. I also discussed the importance of considering your data's granularity. The second part of this series will explore the role of variation in causal inference.
Ch. 3 in Analytical Skills treats the problem of coming up with good questions.
The cross-product matrix X’X is singular whenever you have perfect multicollinearity.
Check the conversations in this subreddit.
You can find the code in this Google Colab notebook.
Chapter 10 of Data Science: The Hard Parts discusses this example in detail.